QUICK START GUIDES
- api_endpoint
- atomic_vs_series
- block_executors
- block_publish_marketplace
- building_models_using_rztdl
- create_block
- create_pipeline
- custom_spark_block
- data_transport
- dl_model
- executors
- mlc
- output_15_0
- output_21_0
- publish_custom_dl_layers
- publish_logs_and_metrics
- publish_model
- publish_pipeline
- use_custom_lib
- using_project_space
- create_pipeline
- api_endpoint
- logistic_reregression
API Documentation
Publishing logs and metrics
RZT aiOS allows block developers to publish logs at various levels and publish various metrics so that it can visualized while the block code is running. The logs and metrics associated with a pipeline execution are persisted even after the execution is complete. The metrics can later be used to generate various reports. Block developer can add log messages at various levels
- debug These are debug information that will be logged only in verbose mode and can be used for debugging and inspecting intermediate output. A debug level message can be logged using the api
logger.debug(message_str) - info Informative messages logged to see intermediate results and progress of execution. The api
logger.info(message_string)can be used to log an info message - warning
logger.warn(message_str)api is can be used to log warning messages. - error A block developer can log an error message using the api
logger.error(message_string)
1. Create block with logging
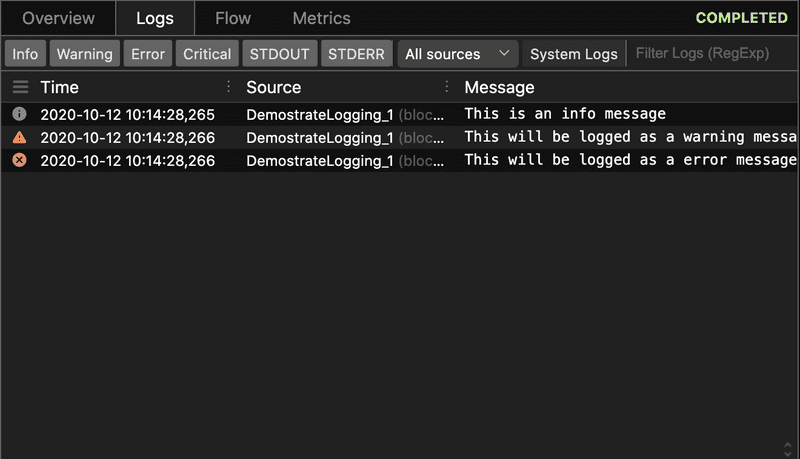
The below blocks illustrates how various types of logs are displayed in pipeline run. The Block class has a logger attribute which has various methods to log messages
import razor.flow as rf
from razor.api import project_space_path
@rf.block
class DemostrateLogging:
    def run(self):
        self.logger.debug("This is a debug message. Will be displayed only in verbose mode")
        self.logger.info("This is an info message")
        self.logger.warn("This will be logged as a warning message")
        self.logger.error("This will be logged as a error message")
Create a pipeline and run the block
logging_block = DemostrateLogging()
pipeline = rf.Pipeline(targets=[logging_block])
pipeline.execute()
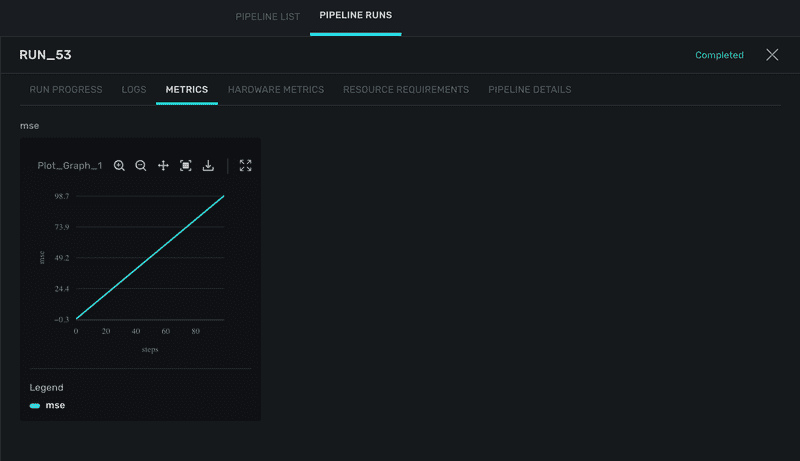
2. Create a block and publish a line graph
from razor.api.core.metrics import LineGraph

@rf.block
class plot_graph():
    def run(self):
        line_graph = {}
        counter = 0
        metrics = {"mse": 1.0}
        while counter < 100:
            for metric_key, value in metrics.items():
                if counter == 0:
                    line_graph[metric_key] = LineGraph(name=f"{metric_key}",
                                                       y_label=[metric_key],
                                                       y_type=float,
                                                       keys=self._block_params,
                                                       x_label='steps')
                line_graph[metric_key].post(x=counter, y=[float(counter)])
                counter += 1
Create a pipeline using the block
plot_graph = plot_graph()
pipeline = rf.Pipeline(targets=[plot_graph])
List all the deployed engines
razor.api.engines()
Run the pipeline.
Replace <Engine Name> with the name of engine
razor.api.engines(<Engine Name>).execute(pipeline)
From IDE go to the pipeline runs page and click on metrics tab to view the graph

